From Reading Reports to Driving Resolution: Operating Risks Spotted About 3 Weeks Earlier
A company with multiple business units and affiliates standardized its KPI definitions, connected ERP, CRM, warehouse, finance and HR data, and built operating dashboards, risk alerts and closed-loop issue handling. Management report preparation time fell by about 60%, and operating risks are now identified about 3 weeks earlier on average.
A diversified company with multiple business units and affiliates had already deployed a range of systems, including ERP, CRM, warehouse, finance and HR management.
These systems handled order processing, purchasing, inventory records and financial accounting, but they did not add up to a single view of the business.
Whenever management wanted to understand sales, profit, inventory, receivables, purchasing or workforce efficiency, it still had to request reports from each department separately.
Even when a metric looked wrong, follow-up usually depended on management pushing each item through meetings or chat groups.
The company had digitized its core transactions, yet it still lacked a complete, digital mechanism for managing the business.
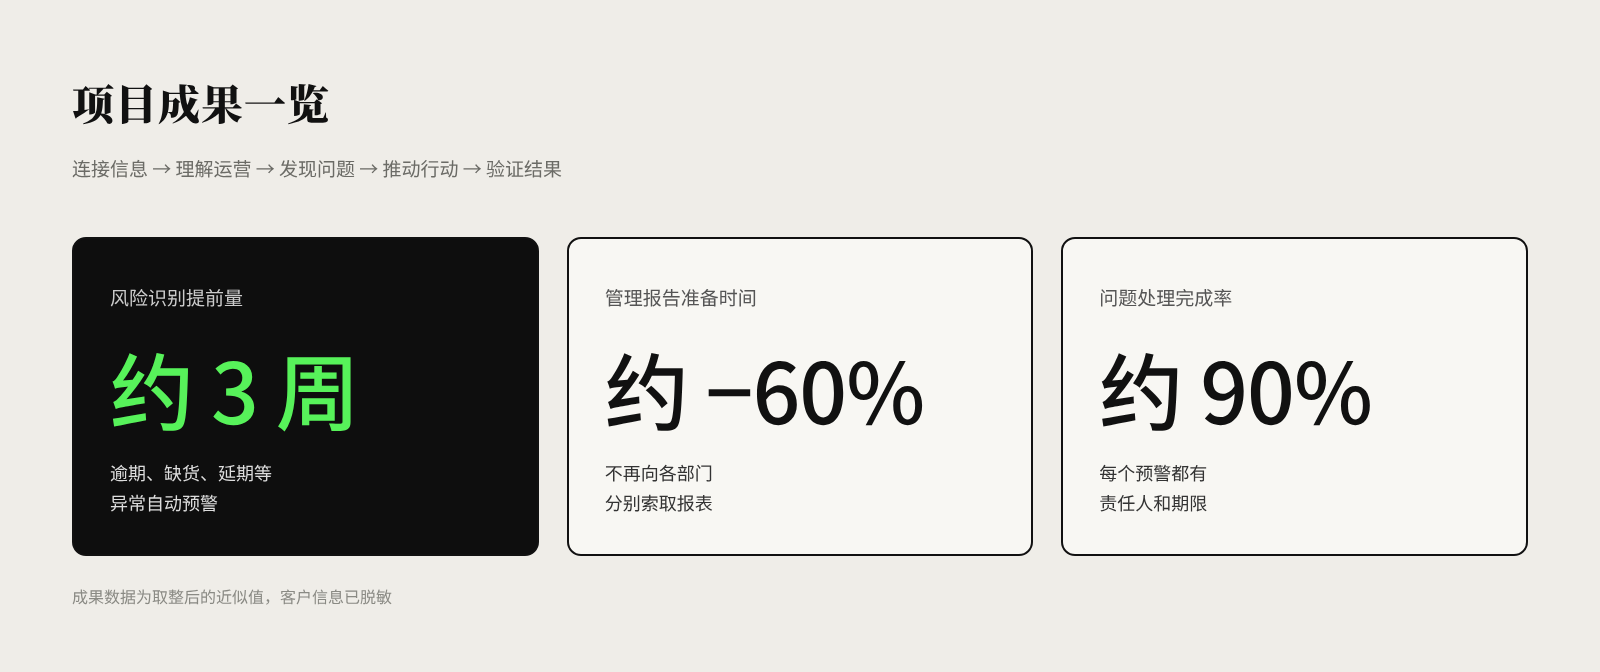
Project results: risks identified about 3 weeks earlier; management report preparation time about −60%; issue resolution rate about 90%
The challenge
Departments understood the same metric differently
Sales counted revenue by order confirmation date, while finance recognized revenue by invoice or accounting period.
The warehouse focused on physical quantities; finance focused on inventory value.
Because of these different definitions, management regularly spent time explaining why the numbers did not match.
Operating data only described the past
Most reports could explain what happened last month, but offered no timely warning of risks ahead.
Excess inventory, overdue customer payments, late purchase deliveries and order fulfilment problems often came to attention only after they had grown.
A gap between spotting problems and solving them
Even when the system raised a red alert, management still had to notify the responsible people manually.
There was no clear ownership, deadline or feedback on the outcome.
SHEPHARD's digital solution
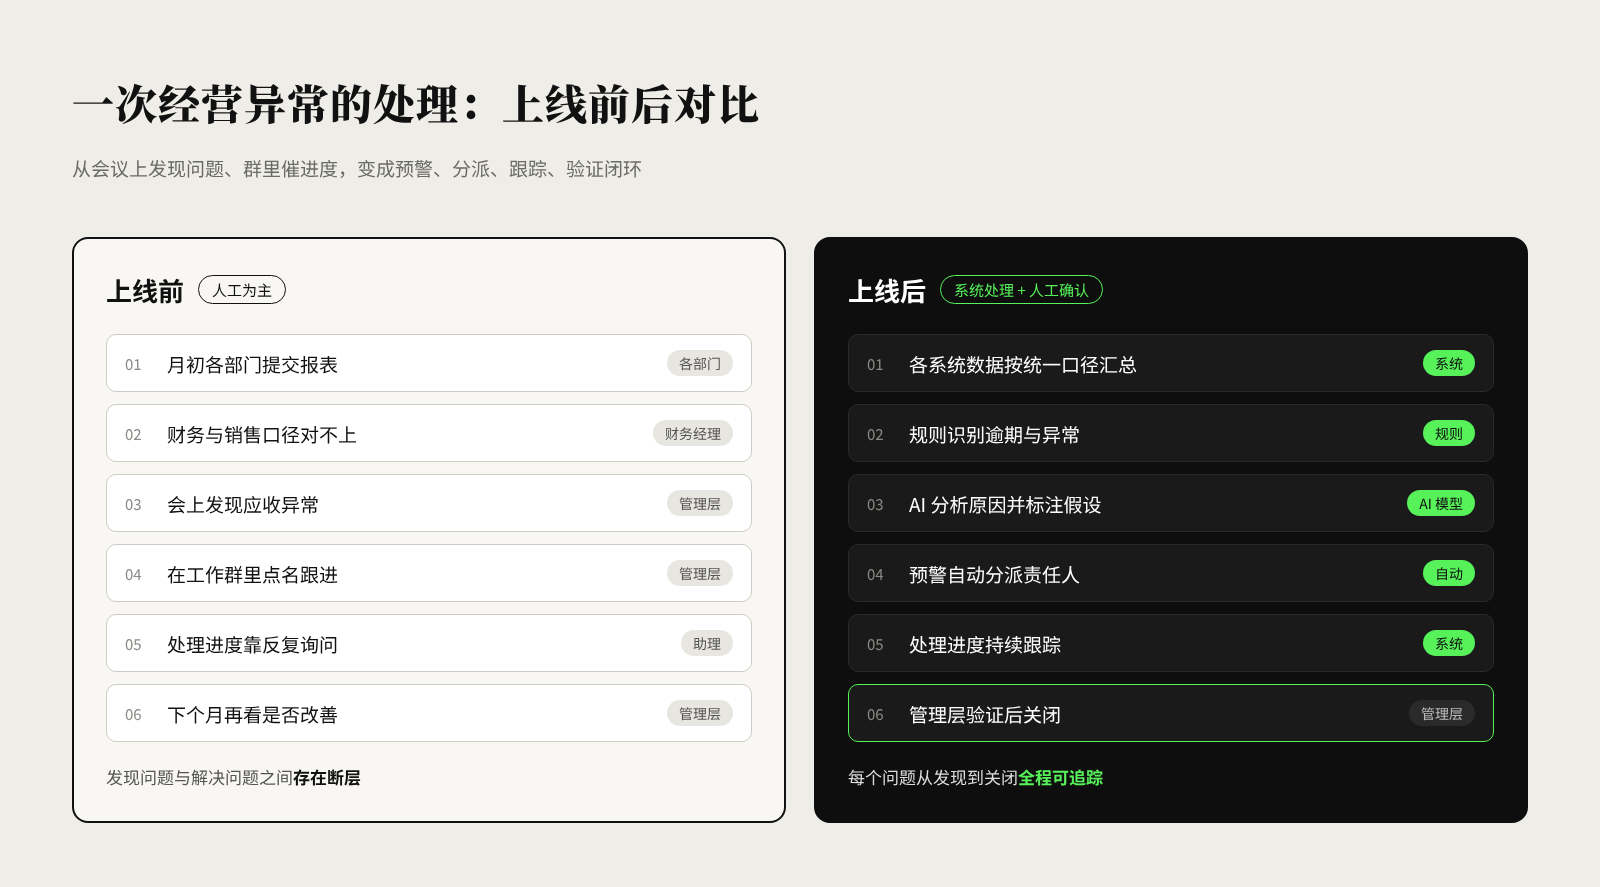
Handling an operating exception: before and after go-live
Step 1: Build a unified KPI framework
We defined the key operating metrics together with senior management and each department.
For metrics such as sales, revenue, gross margin, inventory value, stockouts, overdue receivables and purchase delivery performance, we set out the business meaning, calculation logic and update frequency.
A single metrics dictionary prevents different departments from defining the same metric twice.
Step 2: Establish a cross-system data integration architecture
We connected the existing ERP, CRM, WMS, finance and other business systems.
Master data mapping, data quality checks and common business identifiers produced a cross-departmental operating data model.
For legacy systems, we favoured interfaces and data synchronization approaches that are maintainable and auditable.
Step 3: Build a management cockpit
Key operating data is presented by company, department, product, customer and time period.
Users can drill down from summary metrics to the underlying business detail.
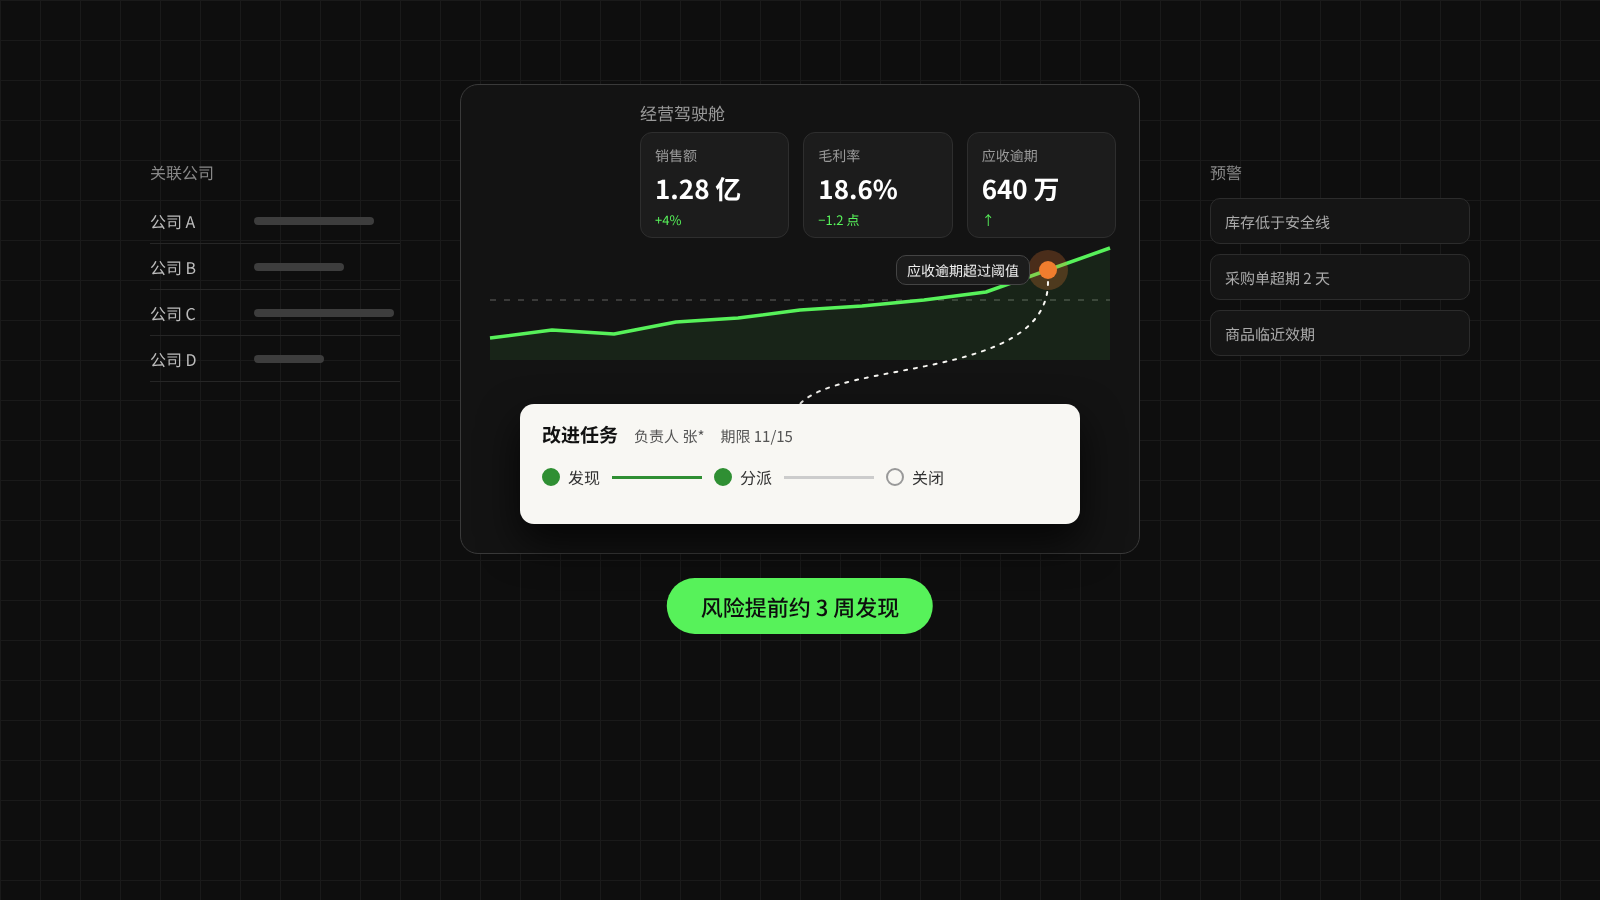
For example, when management notices an unusual rise in receivables, it can look at the customers, invoices, ageing and owners involved, rather than staring at an unexplained total.
Step 4: Set up an operating risk alert system
Business rules flag exceptions such as:
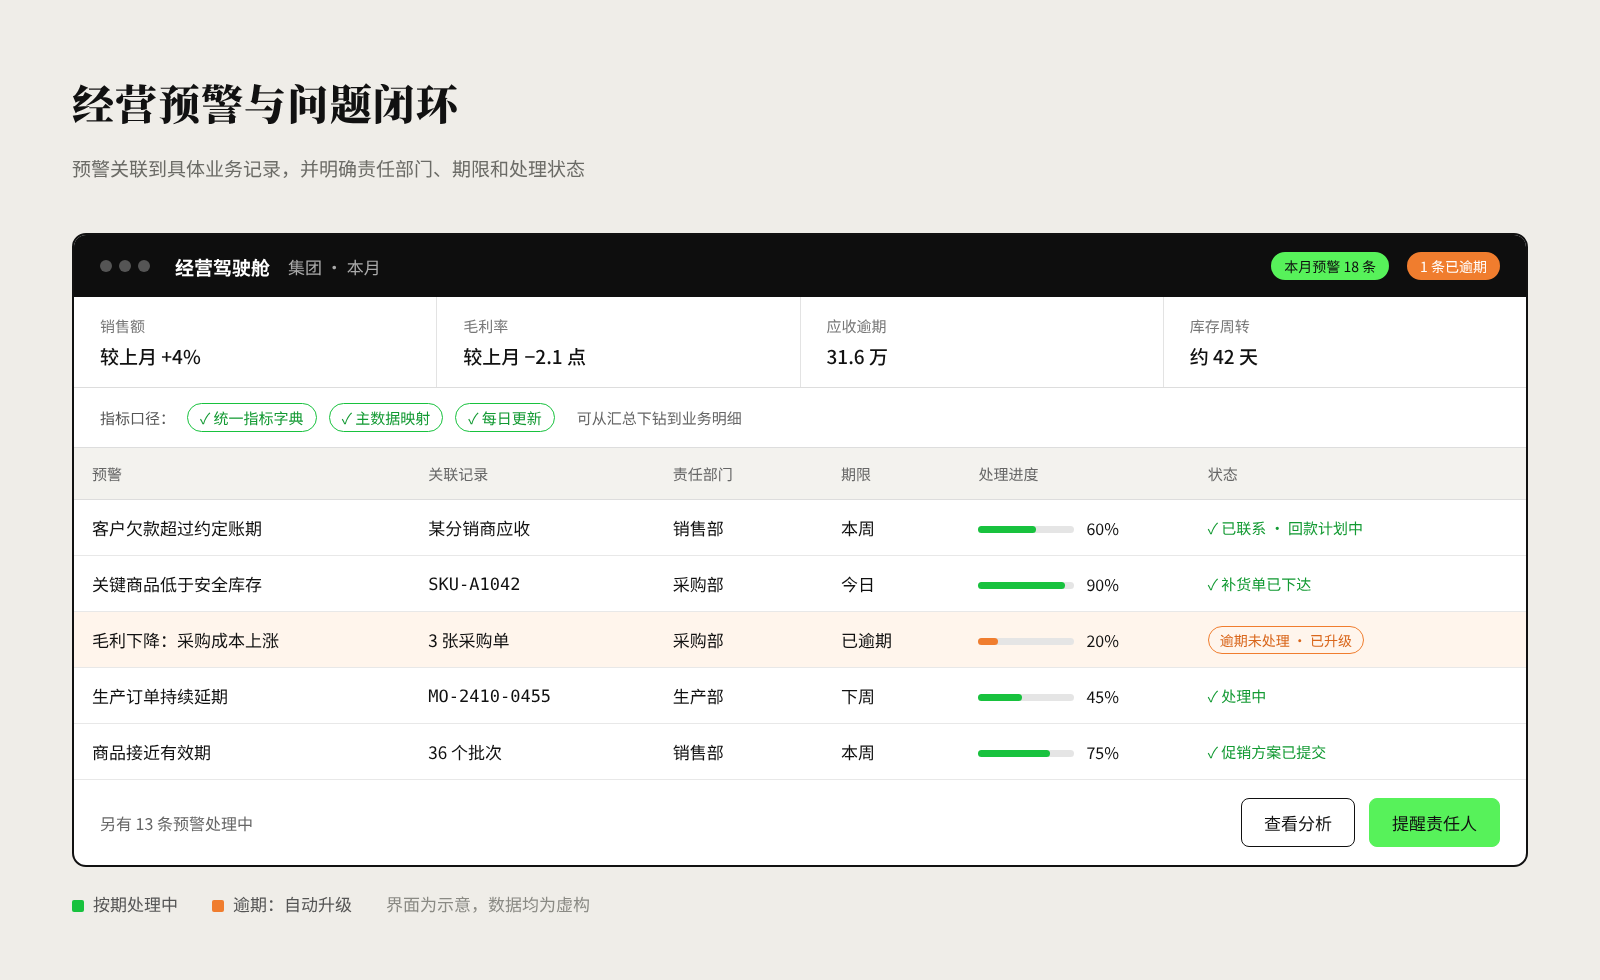
Customer balances past the agreed payment terms.
Stock of key items below safety stock.
Purchase orders past their expected delivery date.
Production orders that keep slipping.
Items that have not sold for a long time or are nearing expiry.
Departmental KPIs persistently off target.
Each alert is automatically linked to the relevant business records and assigned to a responsible department.
Step 5: Introduce permission-controlled AI business analysis
On top of the unified operating data, we added natural-language analysis.
Management can ask questions such as:
“Why did profit fall this month when sales barely changed?”
The system breaks the question down into the necessary data queries and analyses sales mix, purchase costs, product margins, returns and other relevant factors.
Where an inference cannot be proven from the available data, the system clearly states its assumptions and data limitations, so that speculation is never presented as business fact.
Step 6: Enable digital employees and business execution
Digital employees are connected to authorized business capability services.
Based on rules, they can proactively summarize exceptions, remind owners, prepare analysis reports or create tasks for approval.
High-impact actions, such as changing a customer's credit limit, creating a major purchase order or adjusting financial data, require permission checks and, where needed, human approval.
Every action logs the identity, execution parameters, approval record and result.
Step 7: Close the loop on operating issues
Issues that are identified become improvement tasks with an owner, a deadline and a status.
Management can follow each issue throughout its lifecycle, from detection and assignment to resolution and verified closure.
Business analysis no longer stops at presenting information; it connects to the work the company actually does.
Operating alerts and closed-loop issue handling (illustrative interface, all data fictitious)
Implementation roadmap
Phase 1 focused on the data foundation and metric governance, so that every department could rely on trustworthy operating data.
Phase 2 delivered operating dashboards and multidimensional analysis.
Phase 3 introduced risk alerts and departmental handling processes.
Phase 4 gradually added AI analysis and digital employee collaboration once permissions, data quality and approval mechanisms had matured.
Each phase was accepted independently, to avoid building complex AI applications before the data foundation was reliable.
Business value
The company moved from relying on periodic reports submitted by individual departments to having unified, timely and traceable operating information.
Management can now not only see where the business stands today, but also spot risks early, assign clear responsibility and track issues through to resolution.
Project results (approximate): risks identified about 3 weeks earlier; management report preparation time about −60%; issue resolution rate about 90%.
Metrics tracked on an ongoing basis: operating data latency, key metric consistency rate, lead time in identifying exceptions, issue resolution rate, management report preparation time, automated workflow success rate.
What this case teaches us
The end goal of digital transformation is not more software, more reports or more AI models.
A truly mature intelligent operating system should form a complete management chain:
When a system can not only answer “what happened” but also help the business understand “why it happened”, decide “who should handle it” and track “whether the problem was really solved”, digitalization starts to shift from a technology project to a lasting operating capability.
*To protect client confidentiality, company details in this case study have been anonymized, interface screenshots are illustrative, and results are rounded approximations.*
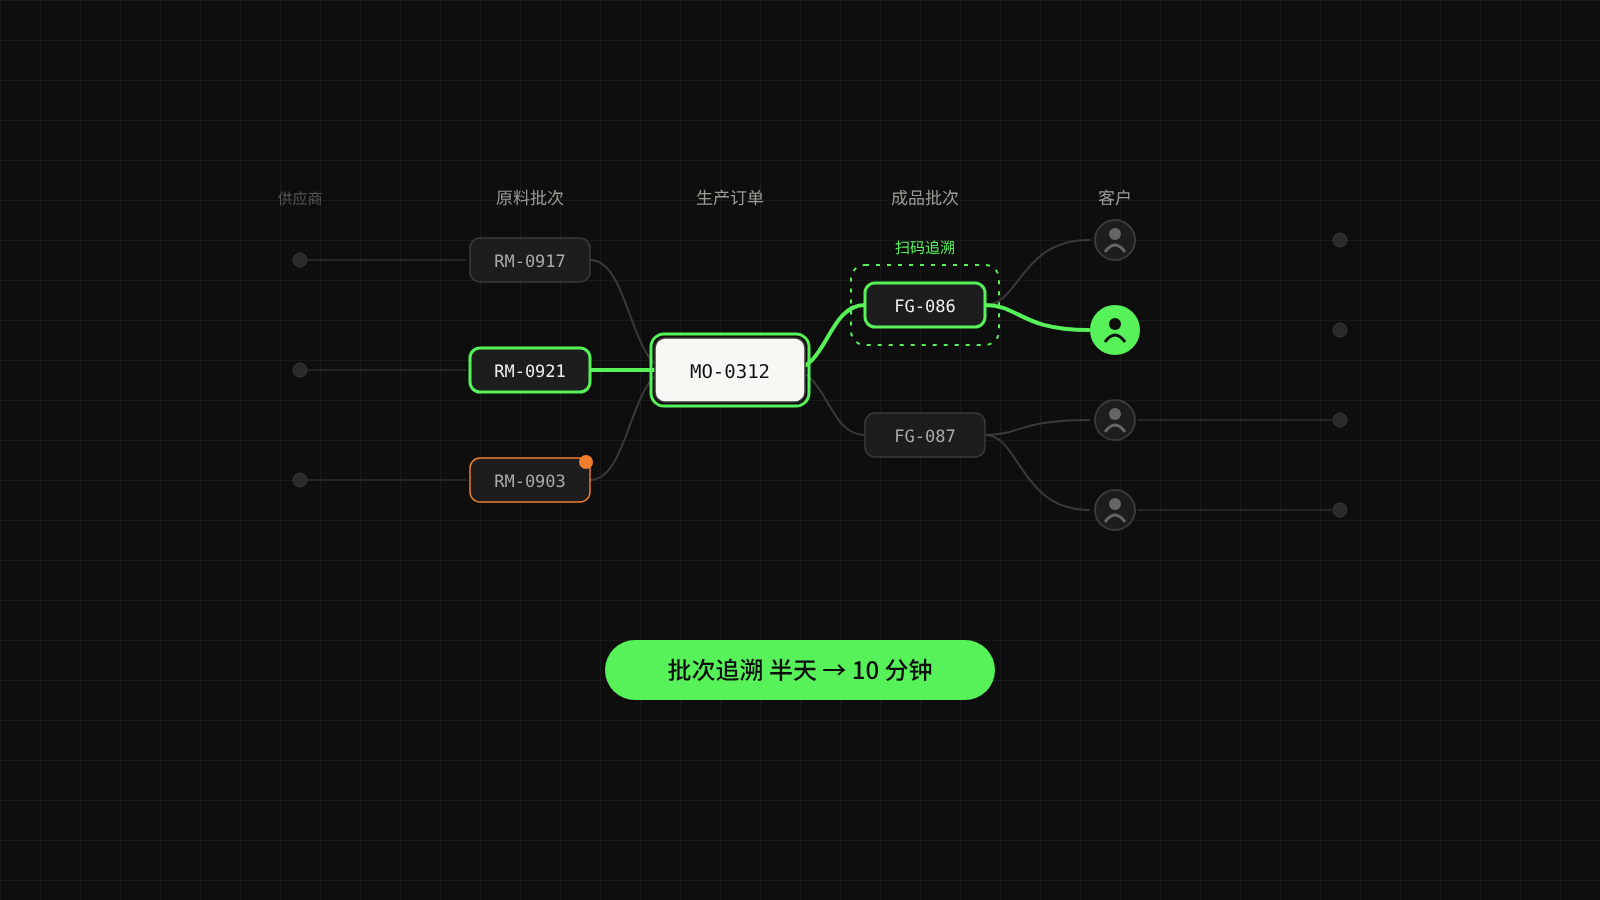
Batch Traceability Cut from Half a Day to 10 Minutes, with Every Batch Accounted For
A multi-category food manufacturer linked purchasing, production, warehousing and sales delivery into a single data chain. Any finished-goods batch can now be traced back to its raw material sources and forward to its customers, and batch traceability has dropped from about half a day to under 10 minutes.
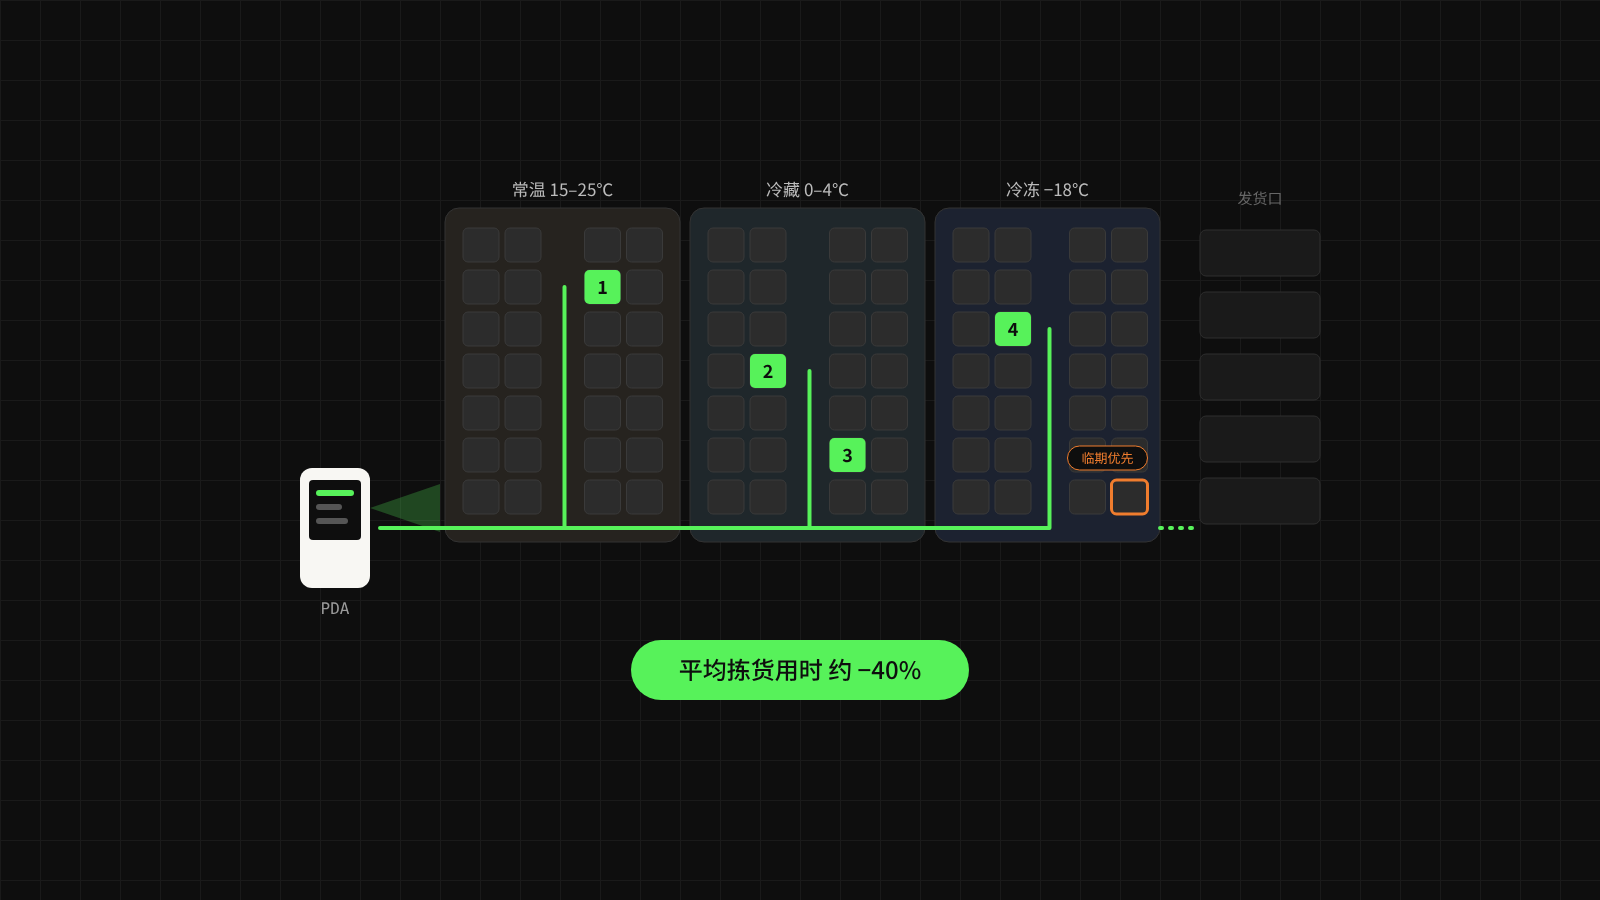
Three-Temperature Inventory Tracked to the Bin, Average Picking Time Down About 40%
A wholesaler of ambient, chilled and frozen food tracked inventory down to bin location and batch, used PDAs for receiving, replenishment and picking, and dispatched stock on a first-expired, first-out basis. Average picking time fell by about 40%, and the value of stock nearing expiry dropped significantly.
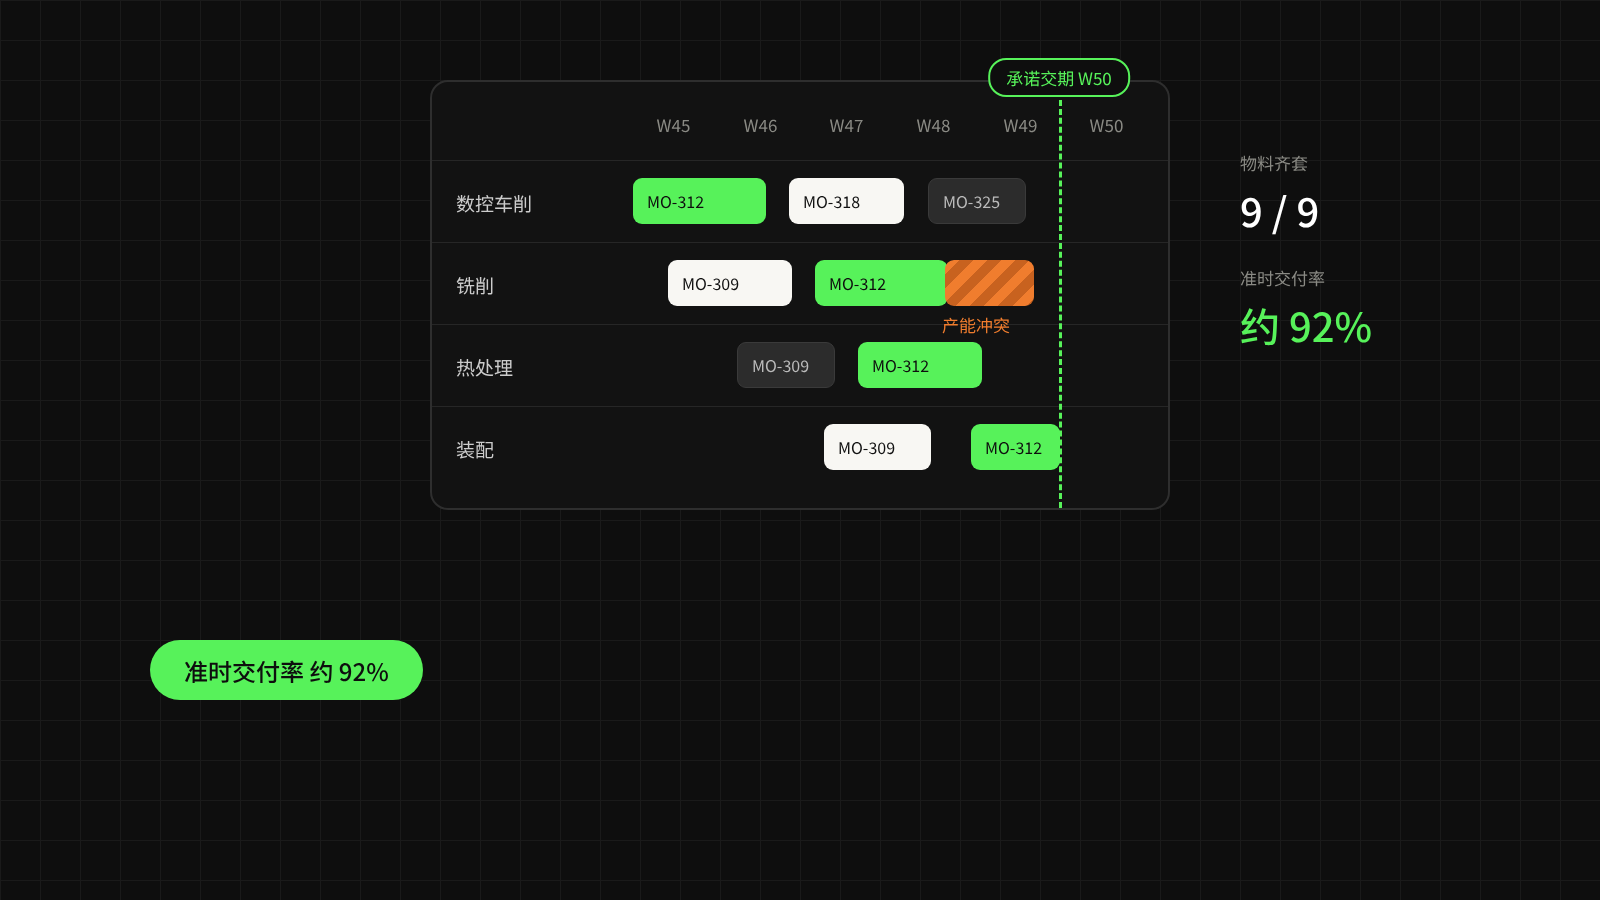
Sales Orders Drive the Production Plan Directly, Lifting On-Time Delivery to About 92%
A high-mix, low-volume machining company let sales orders drive material requirements and capacity checks directly, with shop-floor terminals reporting progress in real time. Delivery promises are now grounded in data, on-time delivery rose from about 75% to about 92%, and stoppages due to material shortages fell markedly.