For wholesale distributors, inventory is the largest pool of working capital and the hardest ledger to manage. One part of the warehouse is stacked with slow-moving stock nearing its expiry date, while the best-sellers customers urgently need are out of stock. Many companies still place orders based on their buyers’ experience and an Excel spreadsheet, and when people change, the rhythm falls apart. The value of AI demand forecasting is not a “spot-on” number, but turning ordering from a gut-feel exercise into a decision that is evidence-based, testable and continuously improvable.
So where exactly does AI forecasting outperform traditional methods, what can and can’t it do, and how should a company get started? In this article, we cover the root causes of inventory problems at wholesale distributors, how machine-learning forecasting differs from traditional methods, what data AI forecasting can draw on and where its limits lie, how to measure forecast accuracy, and a step-by-step rollout that starts with a handful of priority SKUs.
Why do wholesale distributors always seem to have too little and too much stock at once?
Stockouts and overstock existing side by side looks contradictory, but they are two sides of the same problem. The root cause is a systematic gap between order quantities and real demand — and most companies can neither see this gap nor continuously correct it.
Inventory challenges at wholesale distributors usually stem from the following:
- Too many items and customers for people to manage. Distributors often carry a large number of SKUs (stock keeping units) and serve many stores, restaurants or downstream dealers. Buyers can only keep a close eye on a few dozen major items; most of the rest are replenished out of habit.
- Order swings amplify demand. Downstream customers tend to order in batches and stock up all at once, and order volumes jump suddenly before holidays and during promotions. Treat these short-term peaks as the norm and you over-order next time; ignore seasonal patterns and you run out in peak season.
- Heavy pressure from expiry and shrinkage. Categories such as food, beverages and household chemicals have a limited shelf life. Over-ordering not only ties up cash but can also mean markdowns near expiry or outright write-offs.
- Incomplete stockout records. When a customer asks for an item that is out of stock, the order is often cancelled or switched to another product. The system records only “how much was sold”, not “how much the customer wanted to buy”. Ordering on this data systematically underestimates demand for best-sellers.
- Reliance on individual experience. Experience is valuable in a stable environment, but it is hard to replicate and struggles to answer “how much should we order this time, and why?”
Take a frozen-food distributor supplying restaurants. Ahead of Chinese New Year, it stocked up based on last year’s volumes, but this year several large customers stocked up earlier and the distributor ran out two weeks before the holiday. After the holiday, it replenished to the pre-holiday peak, leaving some items sitting in the warehouse until they neared expiry. The problem is not that buyers aren’t working hard enough; it is that weighing seasonality, customers, promotions and lead times all at once is simply beyond what the human brain can do.
How does AI demand forecasting differ from traditional methods?
Traditional ordering methods mostly rely on judgement, or on a moving average (the average sales of the last few weeks or months) to estimate next-period demand. What sets machine-learning forecasting apart is that it can weigh many influencing factors at once, produce a separate forecast for every SKU and every customer segment, and keep updating as new data comes in.
The table below compares the main differences between the two approaches:
| Dimension | Judgement / moving average | Machine-learning forecasting |
|---|---|---|
| Basis | Average sales over a recent period plus personal judgement | Historical sales plus multiple influencing factors |
| Factors considered | Usually sales alone | Promotions, prices, seasons, holidays, weather, customer orders, etc. |
| Coverage | Key items watched manually, the rest ordered by habit | Every SKU can be forecast individually |
| Promotions and holidays | Rely on manual adjustment | Learns their impact from historical data |
| Update frequency | Adjusted monthly or quarterly | Can be updated weekly or even daily as new data arrives |
| Explainability | Easy to understand | Key drivers need to be surfaced explicitly |
| Data requirements | Low | Needs fairly complete, clean historical data |
| Best suited to | Stable demand, few items | Many items, strong promotional and seasonal effects |
It is worth stressing that machine learning is not always better than simple methods. When demand is stable and the range is small, a moving average may be enough; machine learning pays off mainly where there are many items and complex drivers.
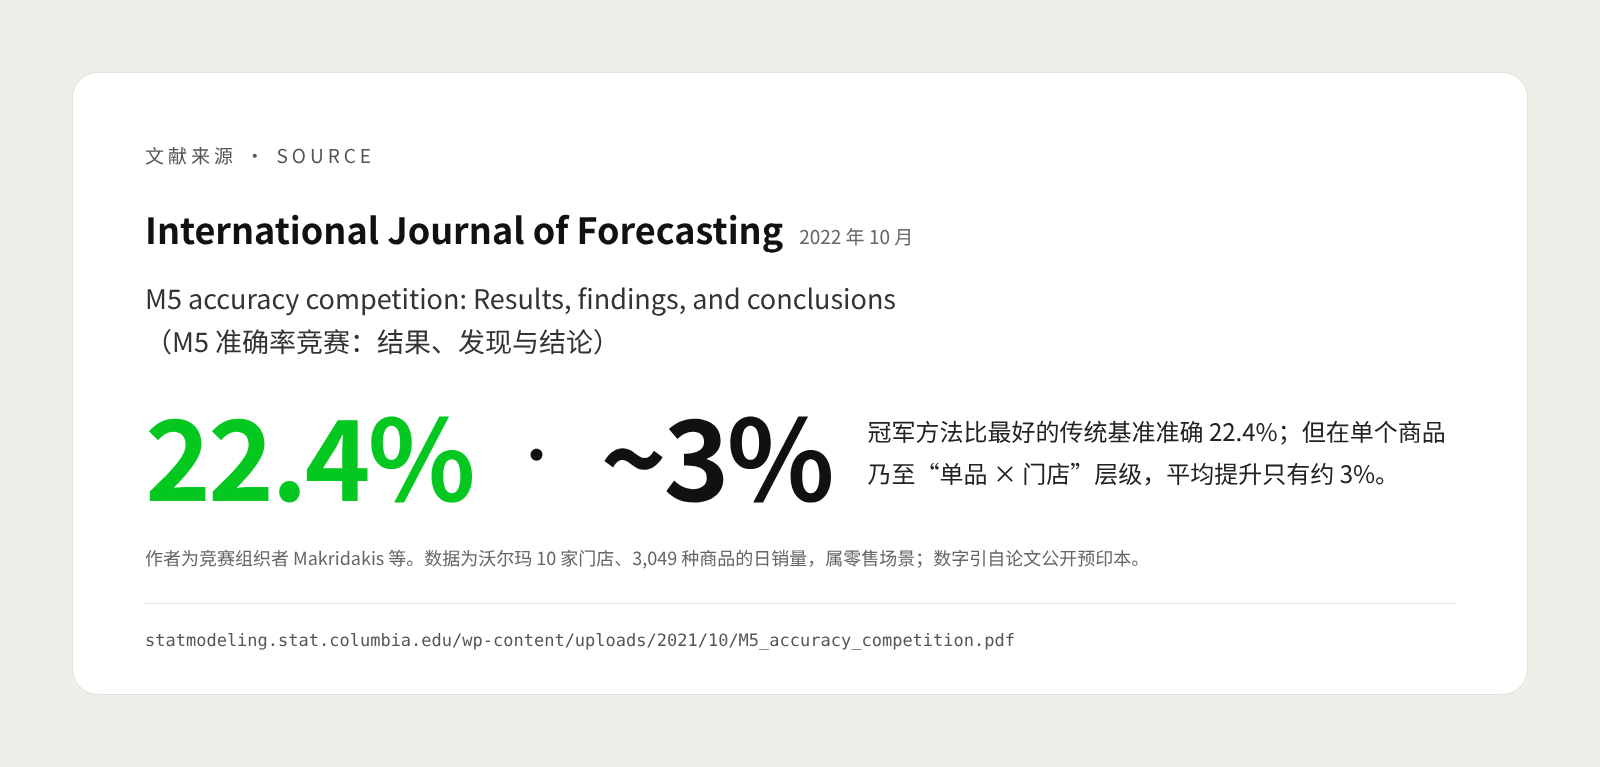
Academic research offers solid evidence on this. The well-known M5 forecasting competition asked participants to forecast daily sales of 3,049 products across 10 stores of US retailer Walmart. The organizers’ paper in the International Journal of Forecasting shows that the winning method was 22.4% more accurate than the best-performing traditional benchmark, that most of the top-ranked methods were based on a machine-learning algorithm called LightGBM, and that all winning solutions used external information such as prices, promotions and special days like holidays (source). The paper also notes, however, that the gains shrink at finer levels: at the level of individual products, and even of “product × store”, the average improvement over the benchmark was only about 3%. These figures come from a retail setting and from the paper’s publicly available preprint, so they cannot be applied directly to wholesale distribution, but they make two points: external information genuinely helps, and the more granular the forecast, the harder it gets.
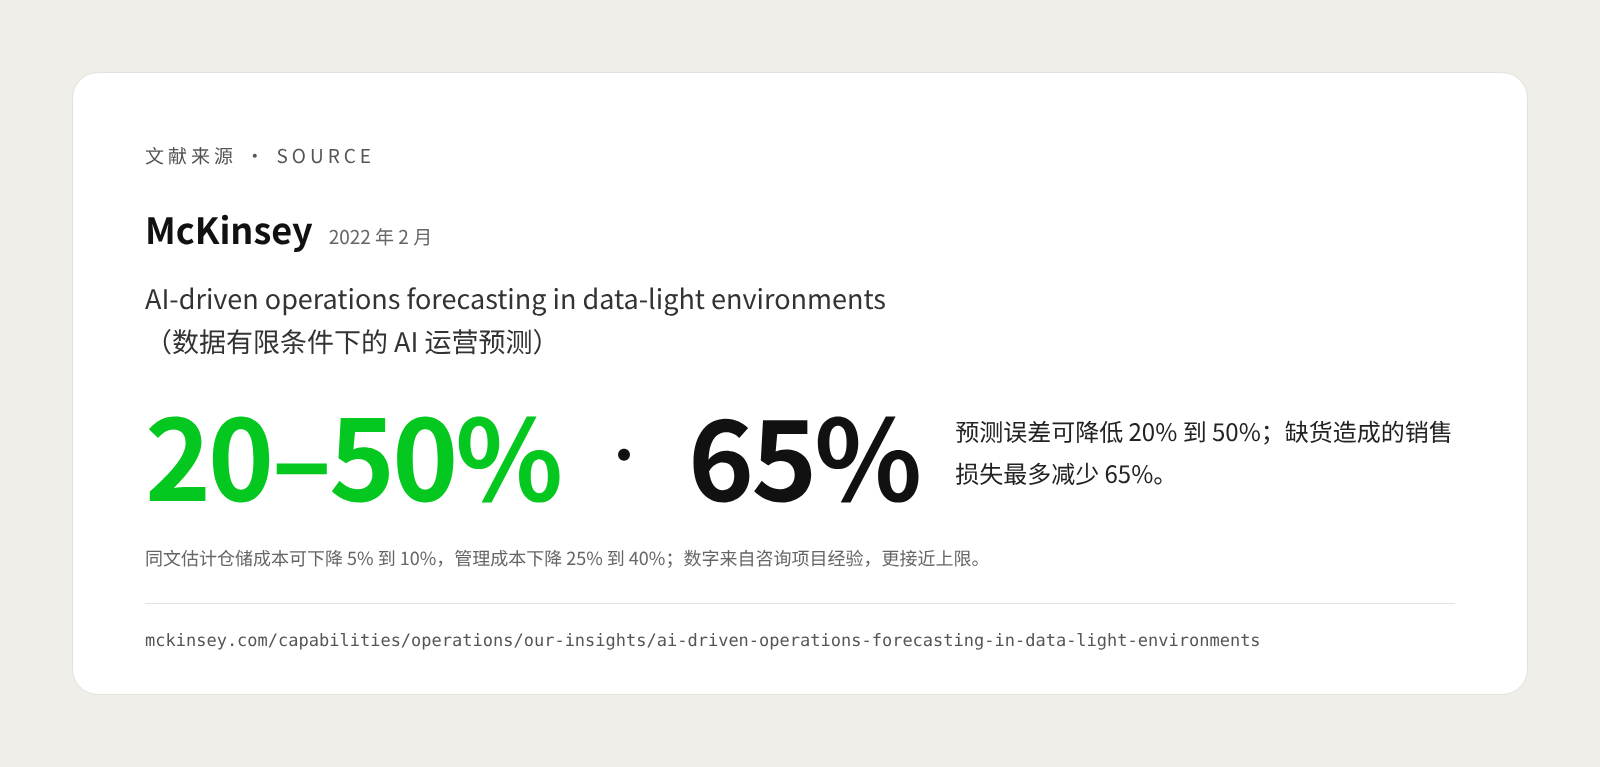
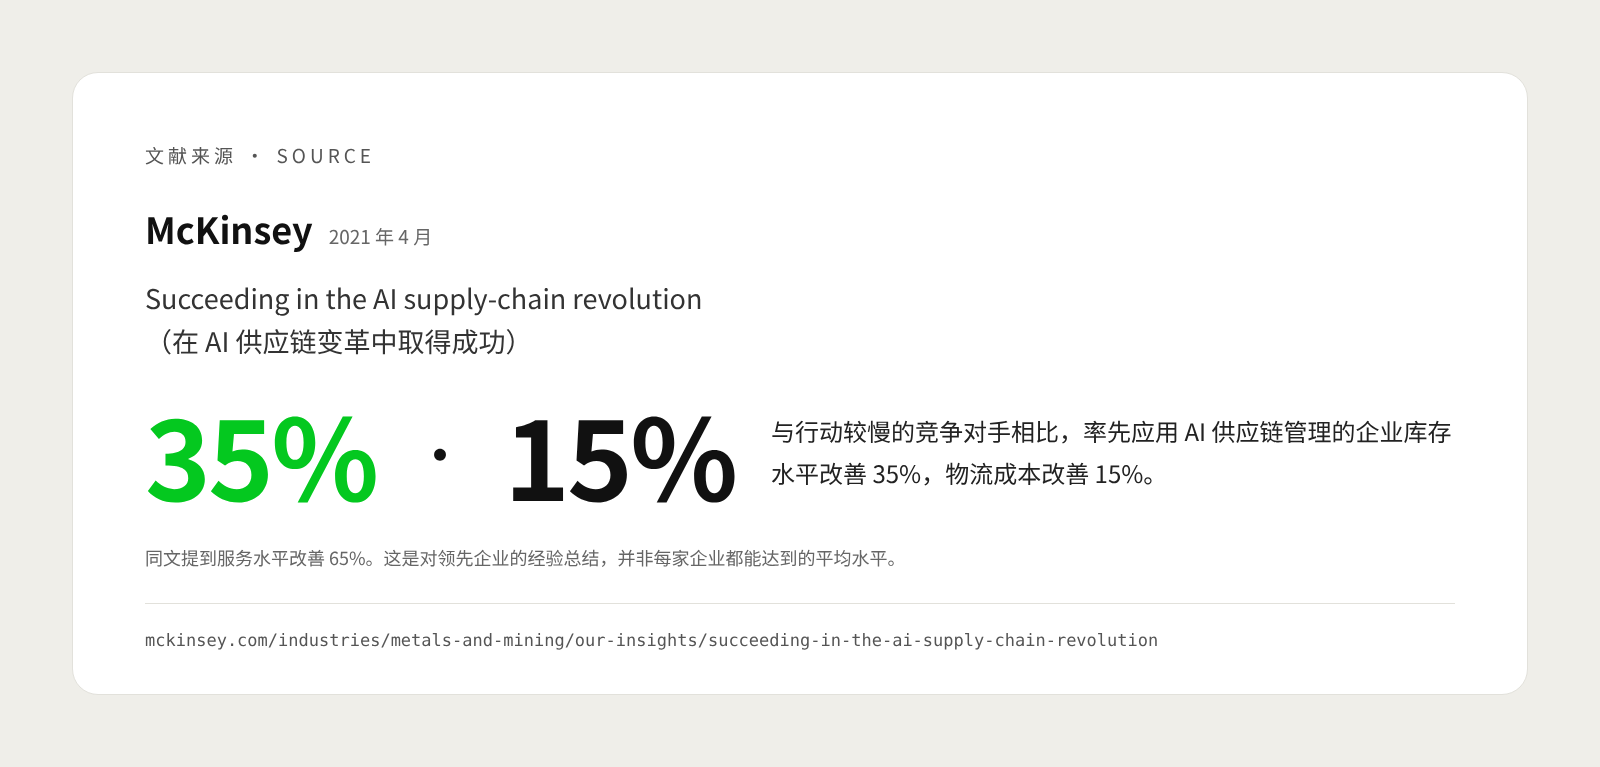
Consulting firms’ project experience points to more optimistic figures. McKinsey’s 2022 article “AI-driven operations forecasting in data-light environments” estimates that applying AI forecasting to supply-chain management can reduce forecasting errors by 20% to 50%, cut lost sales due to stockouts by up to 65%, lower warehousing costs by 5% to 10% and reduce administration costs by 25% to 40% (source). Another McKinsey article from 2021, “Succeeding in the AI supply-chain revolution”, notes that compared with slower-moving competitors, early adopters that successfully implemented AI-enabled supply-chain management improved logistics costs by 15%, inventory levels by 35% and service levels by 65% (source). These figures are distilled from consulting engagements and are closer to an “upper bound when done well” than to an average every company can achieve.
What data can AI forecasting use, and what can’t it do?
How well AI forecasting performs depends largely on the data you feed it. The closer the data is to real demand, the more useful the forecast; where there is no history to learn from, even the best model can only offer a reference point.
For wholesale distributors, commonly used data includes:
- Historical sales. The core data, ideally recorded by SKU, customer and warehouse, daily or weekly. Use customer order quantities wherever possible, not just actual shipments, because shipments are distorted by stockouts.
- Promotions and prices. Promotion dates, discount depth and price changes. Without these records, the model will mistake promotion-driven peaks for normal demand.
- Seasons and holidays. Chinese New Year, the Mid-Autumn Festival, back-to-school season, peak tourist season and so on. Demand in many categories follows clear cyclical patterns.
- Weather. A strong factor for beverages, ice products, seasonal ingredients and similar categories. McKinsey’s article cited above also lists weather among the external data commonly used in forecasting.
- Customer orders and plans. Advance orders from key accounts, store opening plans and contractual supply volumes often say more about demand over the next few weeks than historical data does.
- Stockout and substitution records. Recording which orders were cancelled or substituted because of stockouts helps reconstruct the true demand that was suppressed.
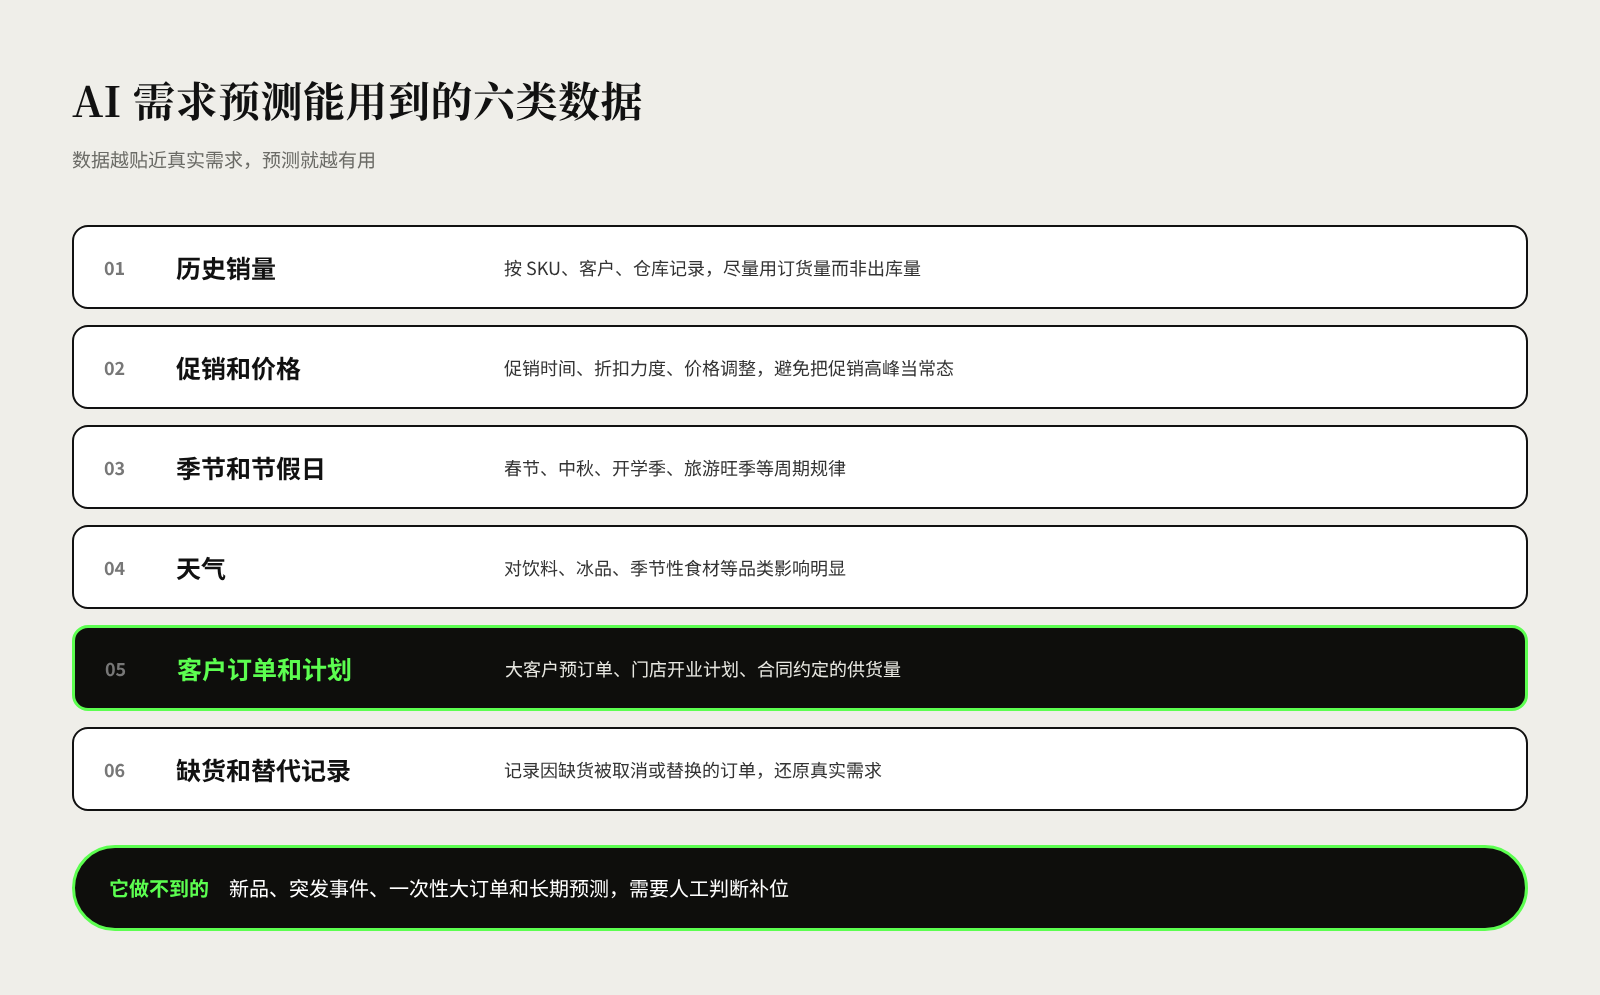
Equally important is understanding the limits of AI forecasting:
- New products. With no sales history, new products are hard for a model to forecast directly. A common approach is to draw on the history of similar products, or to rely mainly on human judgement in the early weeks after launch.
- Unexpected events. Pandemics, extreme weather, supply disruptions and sudden price cuts by competitors cannot be learned from historical data. McKinsey also cautions that abnormal periods such as the pandemic disrupt models and require the data to be smoothed or treated separately; when demand swings sharply, models that lean too heavily on historical data will fail.
- One-off large orders. An occasional bulk purchase by a single customer, if not flagged, will lead the model to overestimate subsequent demand.
- Long-range forecasts. The longer the forecast horizon, the greater the uncertainty. AI is best at rolling forecasts covering the next few weeks to a few months.
For example, when a household-products distributor introduces a new laundry pod, the model cannot produce a reliable forecast. The purchasing team can set the initial order quantity based on the launch curves of other new products from the same brand, then gradually hand over to the model once a few weeks of real sales data have accumulated.
How do you measure forecast accuracy?
The purpose of measuring forecast accuracy is to judge whether forecasts are improving and whether they can be trusted, not to chase an impressive number. What matters most is not which metric you choose, but comparing against a baseline consistently, using the same metric and the same definitions.
The most common metric is MAPE (mean absolute percentage error). The idea is intuitive: calculate by what percentage the forecast missed the actual in each period, then take the average. For example, if a product actually sold 100 cases and the forecast was 80 cases, the error for that period is 20%. The lower the MAPE, the more accurate the forecast.
But MAPE has a flaw that matters a great deal for distributors. The forecasting textbook “Forecasting: Principles and Practice”, written by academics at Monash University, points out that percentage errors cannot be calculated when actual sales are zero, become extremely large when actual sales are close to zero, and penalize over- and under-forecasting asymmetrically (source). Wholesale distributors carry a long tail of SKUs, many of which sell nothing at all on some days or in some weeks, so calculating MAPE directly can easily produce distorted results.
In practice, therefore, you can combine the following approaches:
- Mean absolute error (MAE). Directly calculates how many units or cases the forecast missed by on average. Expressed in the same units as the business, it is easy to understand.
- Volume-weighted error. Sum the errors across all products and divide by total sales. Best-sellers carry more weight, which better reflects the actual impact on the business.
- Comparison with a simple method. MASE (mean absolute scaled error), described in the same textbook, compares the model’s error with the simplest possible method: using last period’s sales as the forecast. A result below 1 means the model beats the simple method.
- Bias. Check whether forecasts are persistently too high or too low. Persistent over-forecasting leads to overstock and persistent under-forecasting to stockouts — this deserves more attention than the size of the error alone.
Finally, forecast accuracy is only an intermediate metric. What really counts is whether business outcomes — stockout rate, days of inventory, expiry write-offs and order fill rate — have improved.
How do you implement AI forecasting and smart replenishment? A step-by-step guide
Implementing AI forecasting doesn’t require covering every product from day one. Proving results on a handful of priority SKUs first and then expanding gradually is the lowest-risk path, and the one most likely to win the team’s buy-in.
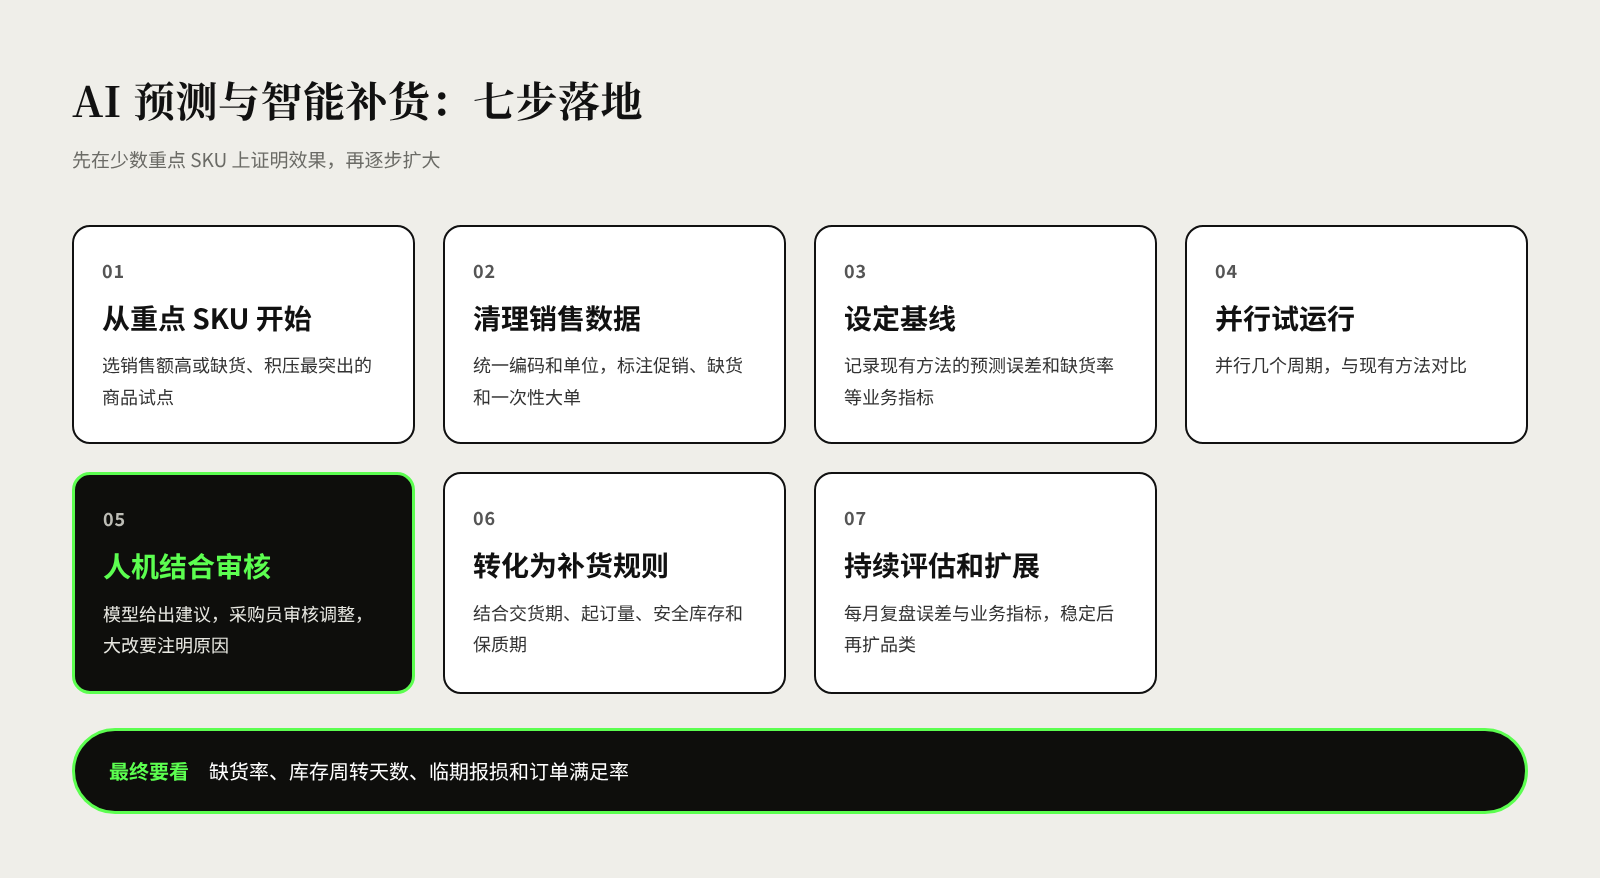
Step 1: Start with a handful of priority SKUs. Select a few dozen to one or two hundred SKUs that account for a large share of sales, or where stockouts and overstock are most acute, as your first pilot batch. For example, choose the top-selling products, plus the categories with the highest write-offs over the past six months.
Step 2: Clean and organize the sales data. Export at least one to two years of historical order data, standardize product codes and units of measure, flag promotion periods, stockout periods and one-off large orders, and strip out returns and internal transfers. Data cleansing is usually the most time-consuming step, and the one that most determines success or failure.
Step 3: Set a baseline. Before introducing AI, record the forecast error of your current method (buyer experience or moving average), together with business metrics such as stockout rate, days of inventory and expiry write-offs. Without a baseline, there is no way to tell whether AI has actually made a difference.
Step 4: Run a small-scale pilot and compare it with your current method. Run the model and the current method in parallel for several ordering cycles and compare their performance using the same set of metrics. At this stage there is no need to order based on the model’s output straight away; the focus is on seeing which products it performs well on and which it struggles with.
Step 5: Set up a human-in-the-loop review process. The model proposes order quantities, and buyers review and adjust them, especially for new products, promoted items and products with known special circumstances. Ask buyers to note a brief reason when they make major changes, such as “key account opening two new stores next month”. These notes improve the quality of the current decision and are also valuable input for improving the model.
Step 6: Turn forecasts into replenishment rules. A forecast only answers “how much will sell”; replenishment also has to answer “how much to order, and when”. Clear replenishment rules need to take into account supplier lead times, minimum order quantities, safety stock, warehouse capacity and shelf life. For example, set lower safety stock and more frequent, smaller orders for products with a short shelf life.
Step 7: Keep evaluating and expanding. Review forecast error, bias and business metrics every month, and analyze the causes for products with large errors. Once results for the pilot SKUs are stable, gradually extend to more categories and warehouses, and regularly update the model with new data.
Frequently asked questions about AI demand forecasting and smart replenishment
Do small and mid-sized distributors have enough data for AI forecasting? In most cases, yes. With one to two years of order data recorded by SKU, you can start with priority products. McKinsey’s article cited above also argues that even where data is limited, most companies have enough to benefit from AI forecasting; they simply need to choose methods suited to small datasets.
Will AI forecasting replace buyers? No, but the focus of their work will shift. Routine calculations and replenishment suggestions are handled by the system, while buyers concentrate on supplier negotiations, new product introductions, exception handling and judging the needs of key accounts.
What level of forecast accuracy counts as good? There is no universal standard; forecasting difficulty varies widely across categories and levels. A more practical approach is to compare against your own baseline and check whether the error keeps falling and whether stockouts and overstock are shrinking at the same time.
Do we need a new ERP or a dedicated system first? Not necessarily. As long as you can export complete order, inventory and product data from your existing systems, you can start a pilot. But if order and inventory data are scattered across multiple spreadsheets with inconsistent definitions, getting your data foundations in order is often more urgent than introducing a forecasting tool.
References
- AI-driven operations forecasting in data-light environments, McKinsey, February 2022
- Succeeding in the AI supply-chain revolution, McKinsey, April 2021
- M5 accuracy competition: Results, findings, and conclusions (full preprint), Makridakis, Spiliotis, Assimakopoulos, International Journal of Forecasting, October 2022 (journal record)
- Forecasting: Principles and Practice (3rd edition): Evaluating forecast accuracy, Rob J Hyndman, George Athanasopoulos, Monash University, accessed November 2026