Store sales drive the central kitchen, cutting food cost ratio by about 2 percentage points
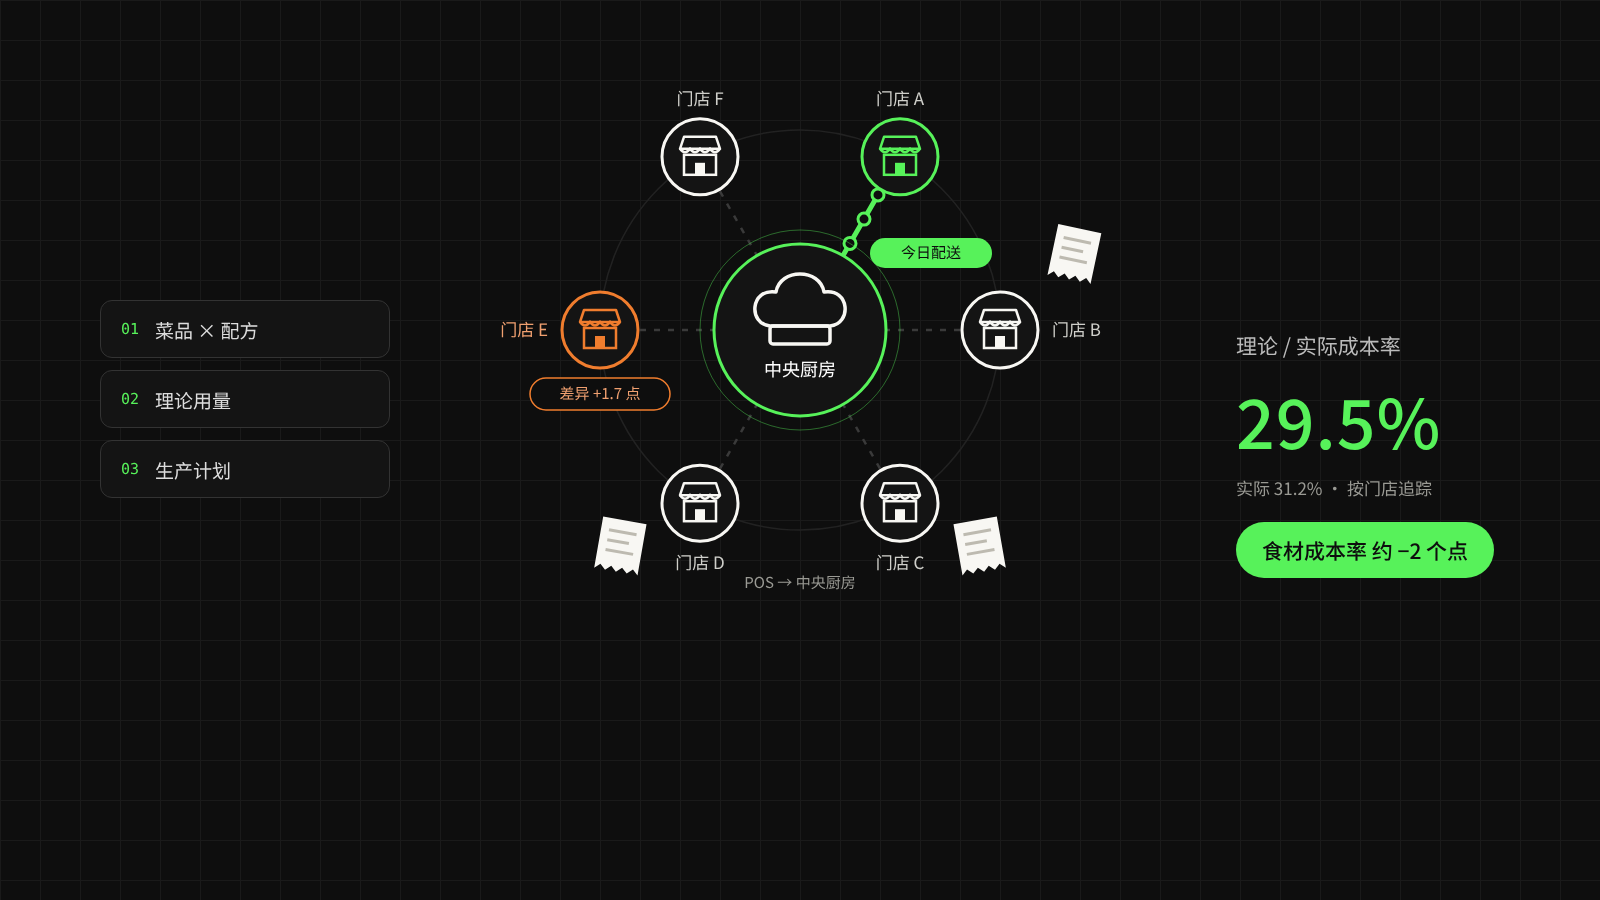
A multi-brand restaurant chain connected store POS, standard recipes, store inventory and central kitchen production. Every sale can be converted into theoretical ingredient consumption, and head office can see which stores have higher waste and how much the central kitchen should prepare.
The company runs several restaurant brands and locations, and has gradually built up centralised purchasing and a central kitchen distribution system.
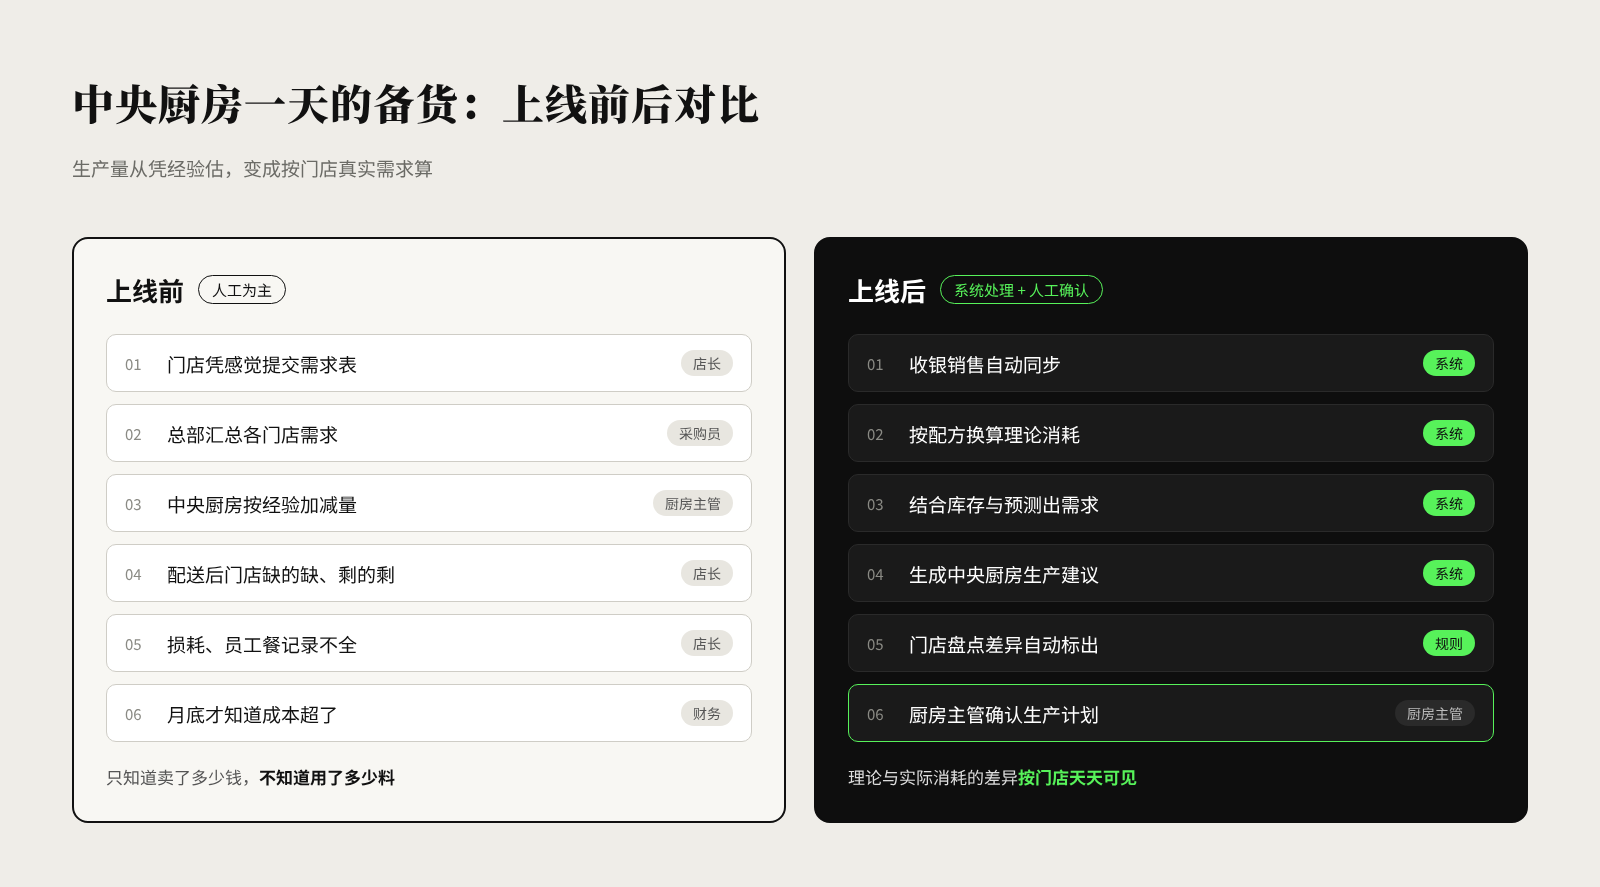
Stores recorded sales in their POS systems, the central kitchen planned production by experience, and buyers ordered raw materials based on requisition sheets submitted by the stores.
As the number of stores grew, head office realised that although it received sales figures every day, it was hard to determine exactly how much of each ingredient was actually consumed, which stores had higher waste, and how much stock the central kitchen should prepare.
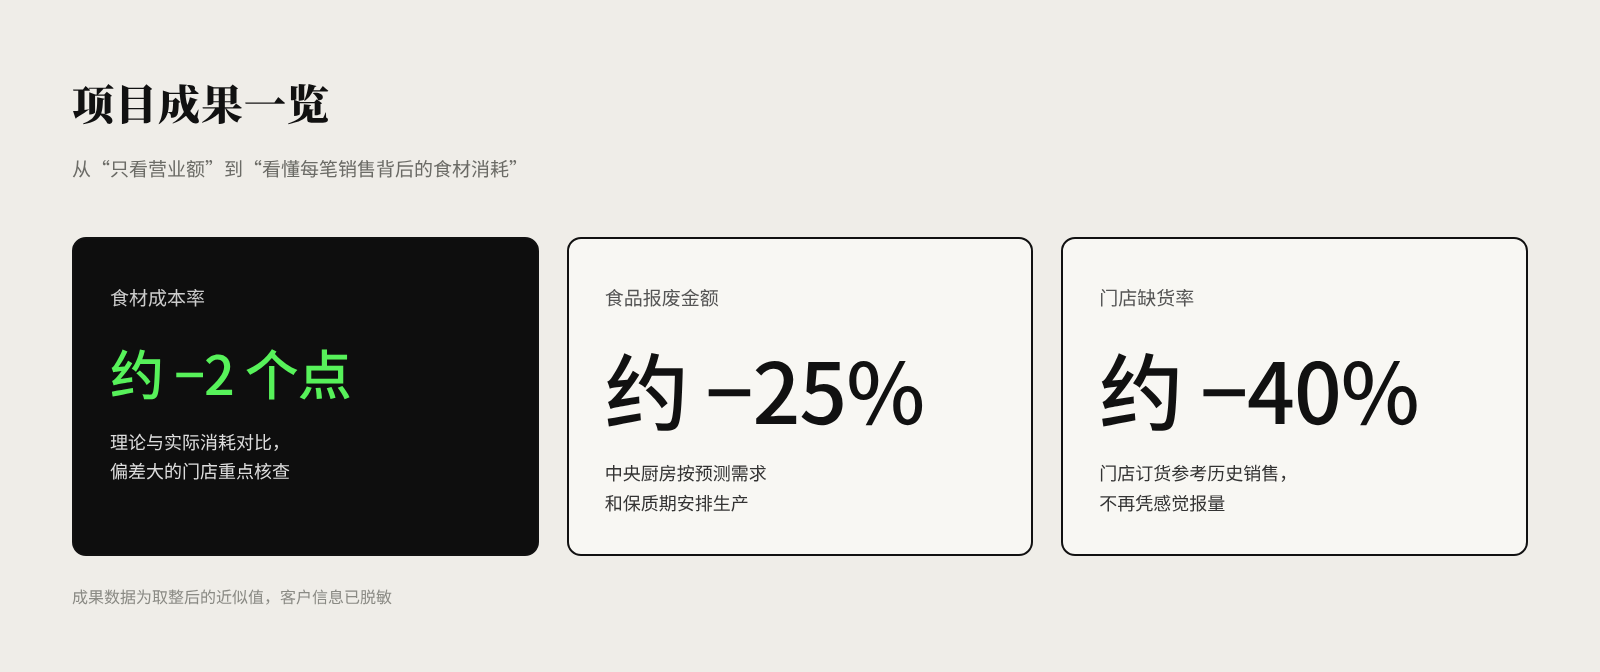
Results: food cost ratio approx. −2 points; food waste value approx. −25%; store stockout rate approx. −40%
The challenge
Sales data could not be turned directly into ingredient requirements
The POS recorded how many menu items were sold, but there was no consistent data relationship between menus, recipes and ingredients.
Store inventory lacked continuous records
Stores did not record losses, waste, staff meals and ad hoc transfers consistently, so theoretical stock did not match actual quantities on site.
Central kitchen production relied on gut feel
Store orders tended to be either too cautious or too aggressive, leaving some products out of stock while others piled up.
SHEPHARD's digital solution
A day of central kitchen preparation: before and after go-live
Step 1: Establish a consistent link between menus and ingredients
Dishes, set meals and retail items sold in stores are linked to standard recipes.
Unit conversion rules and a reasonable loss model allow sales records to be converted into theoretical ingredient consumption.
Step 2: Connect POS and ERP
Store sales, refunds, cancelled orders and promotions are synchronised regularly through an interface.
Business days, stores, sales channels and product codes are mapped consistently.
Step 3: Establish store inventory processes
Store receipts, transfers, losses and stock counts are recorded to a common standard.
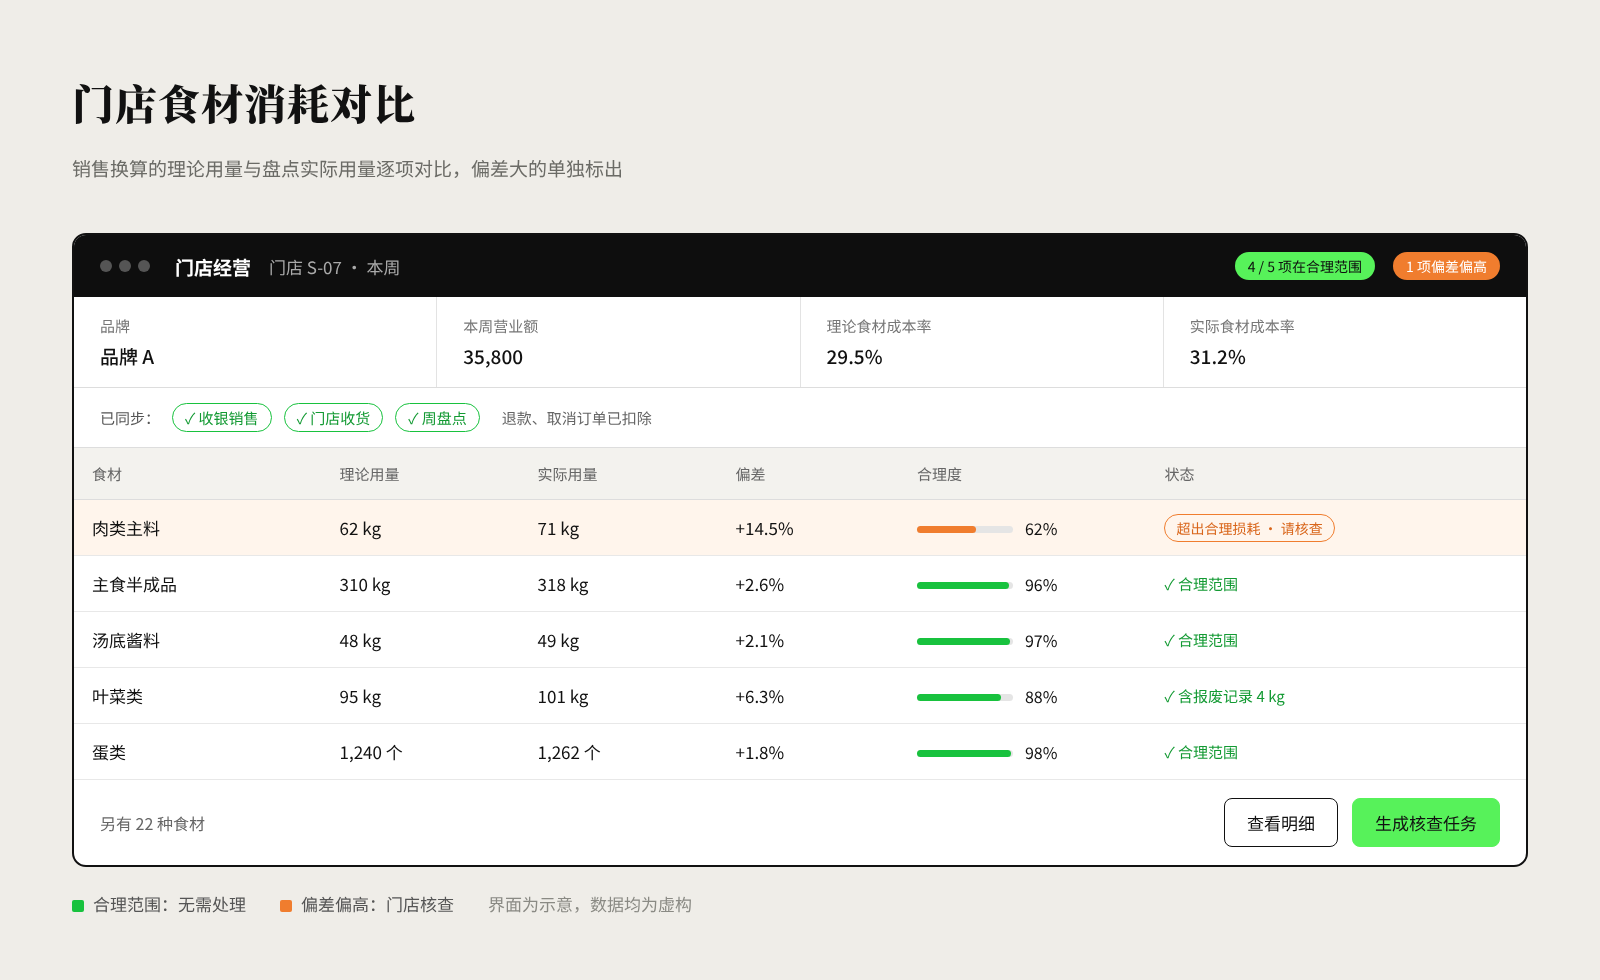
Comparing physical counts with theoretical stock reveals abnormal consumption and inventory variances.
Step 4: Build central kitchen production planning
Production suggestions are generated from forecast store demand, sales history, current stock and product shelf life.
The central kitchen schedules production from orders and forecasts, then distributes finished products according to store requirements.
Step 5: Build store performance analytics
Sales mix, theoretical food cost, actual food cost and losses are analysed by brand, store, dish and ingredient.
Stores that consistently deviate from target are flagged for further review.
Store ingredient consumption comparison (illustrative interface; all data fictitious)
Implementation approach
Stores with the most complete sales data were chosen as pilots, starting with unified product and recipe data.
Once POS and ERP were integrated, store inventory and central kitchen demand planning were introduced step by step.
For information that cannot be captured automatically, such as on-site losses, recording responsibilities must be clearly assigned; algorithmic estimates cannot replace actual management.
Business value
Head office has moved beyond simply watching revenue to analysing the ingredient consumption, purchasing needs and store operating efficiency behind each sale.
Coordination between the central kitchen and stores has likewise shifted from manual planning to verifiable, data-driven decisions.
Results (approximate): Food cost ratio approx. −2 points; food waste value approx. −25%; store stockout rate approx. −40%.
Metrics tracked on an ongoing basis: Food cost ratio, theoretical-to-actual consumption variance, store stockout rate, food waste value, central kitchen production plan attainment.
What this case teaches us
The heart of digitalisation for restaurant chains is not simply running more stores, but enabling head office to understand the supply chain activity behind every sale.
*To protect client confidentiality, company details in this case study have been anonymised; screenshots are illustrative and results are rounded approximations.*
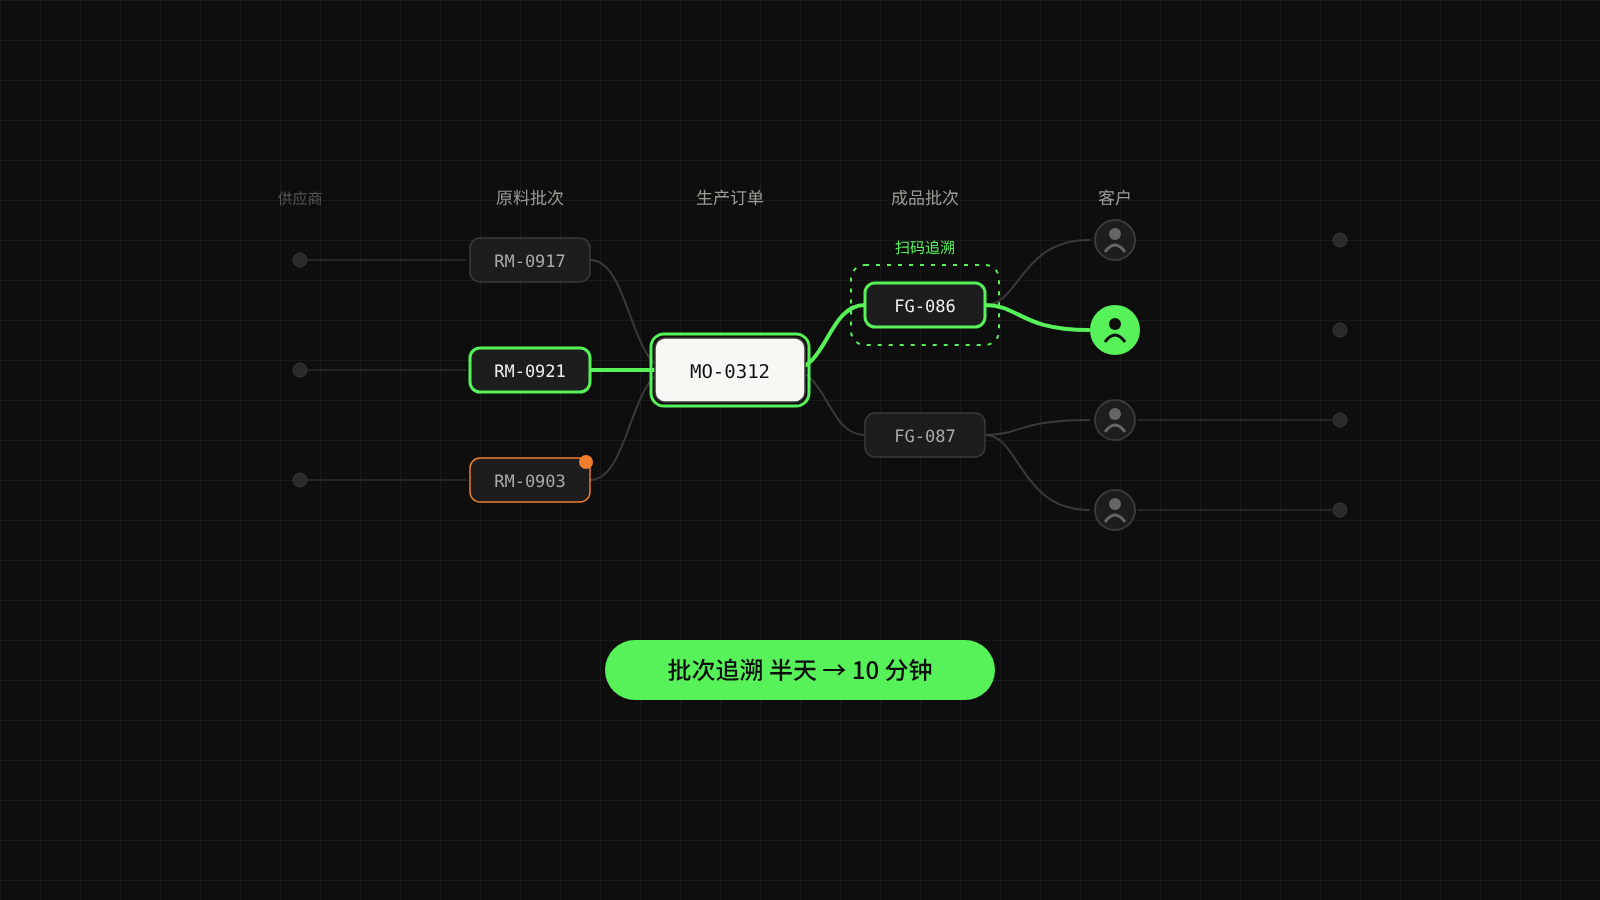
Batch Traceability Cut from Half a Day to 10 Minutes, with Every Batch Accounted For
A multi-category food manufacturer linked purchasing, production, warehousing and sales delivery into a single data chain. Any finished-goods batch can now be traced back to its raw material sources and forward to its customers, and batch traceability has dropped from about half a day to under 10 minutes.
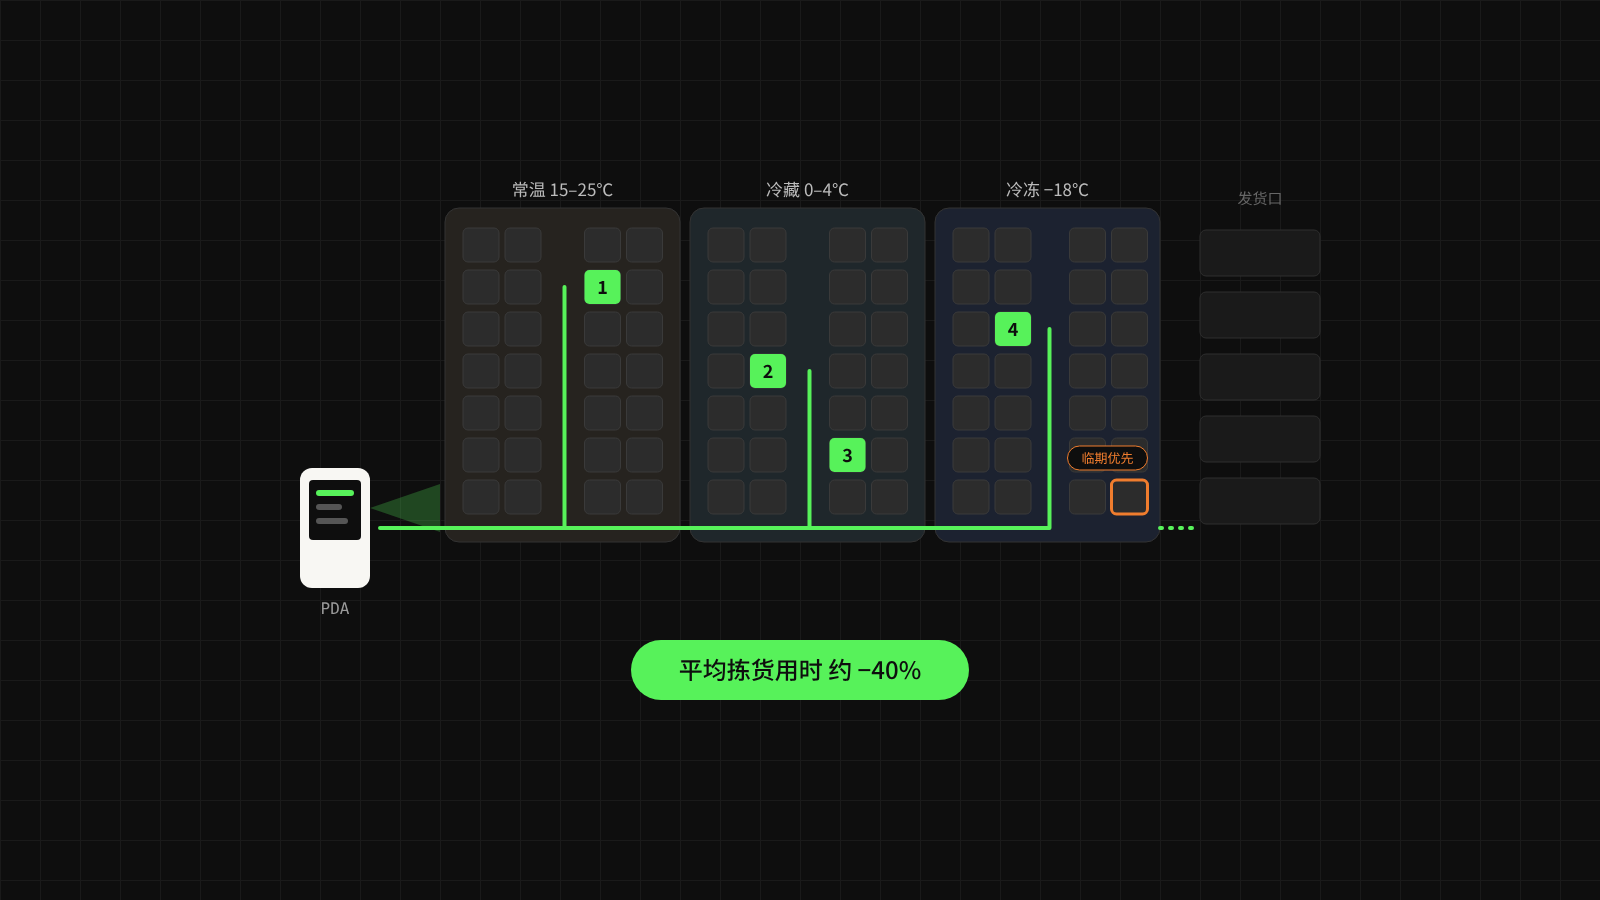
Three-Temperature Inventory Tracked to the Bin, Average Picking Time Down About 40%
A wholesaler of ambient, chilled and frozen food tracked inventory down to bin location and batch, used PDAs for receiving, replenishment and picking, and dispatched stock on a first-expired, first-out basis. Average picking time fell by about 40%, and the value of stock nearing expiry dropped significantly.
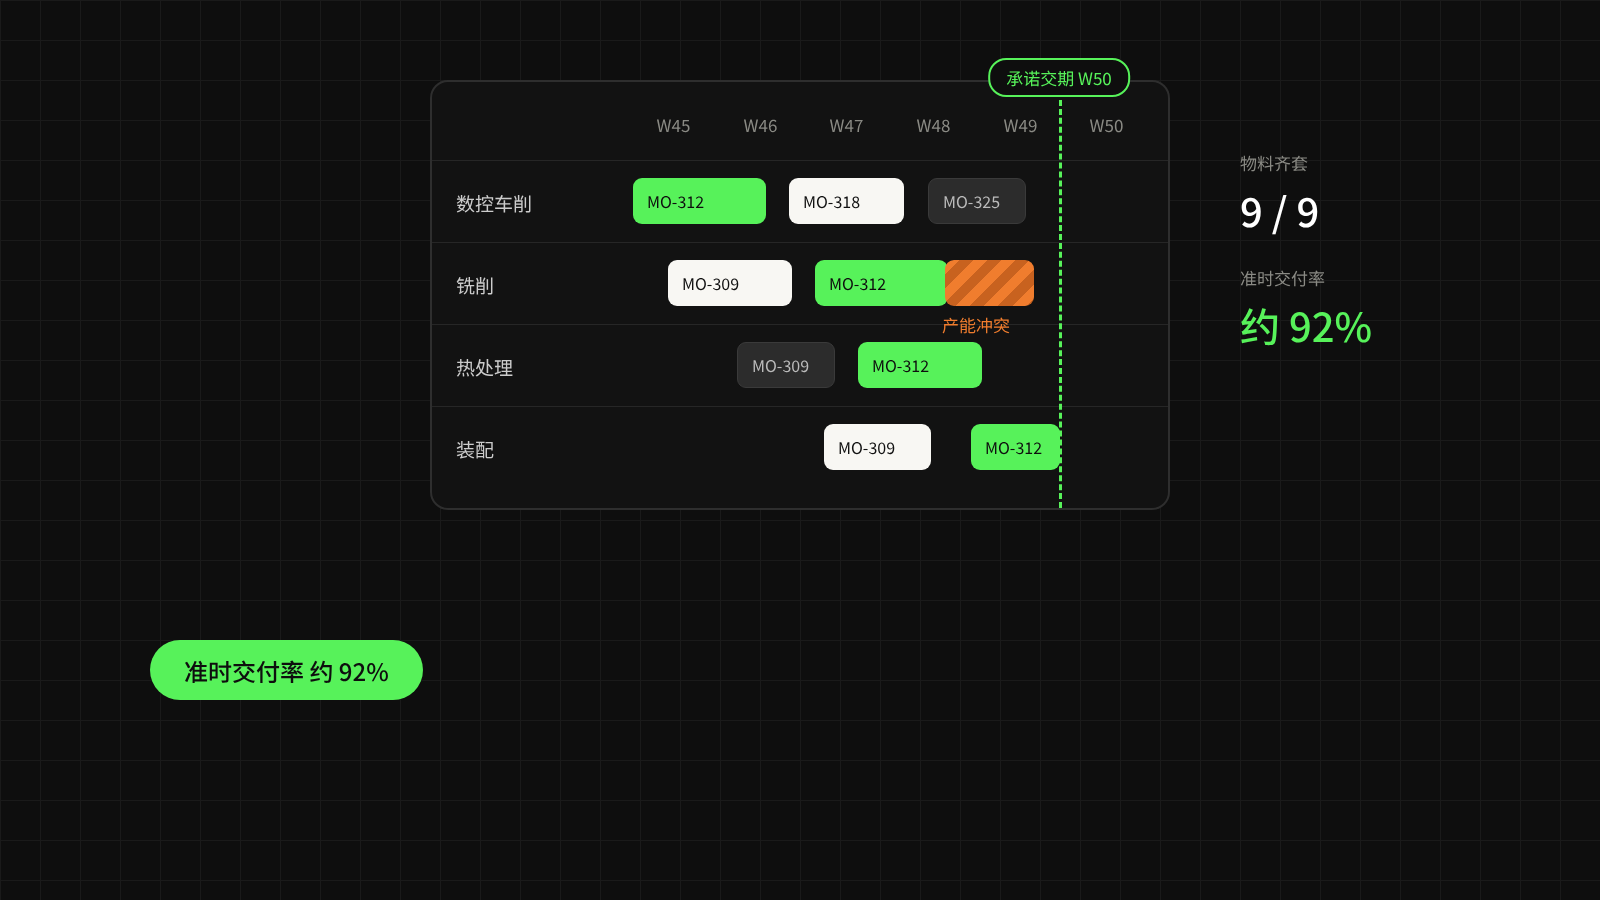
Sales Orders Drive the Production Plan Directly, Lifting On-Time Delivery to About 92%
A high-mix, low-volume machining company let sales orders drive material requirements and capacity checks directly, with shop-floor terminals reporting progress in real time. Delivery promises are now grounded in data, on-time delivery rose from about 75% to about 92%, and stoppages due to material shortages fell markedly.